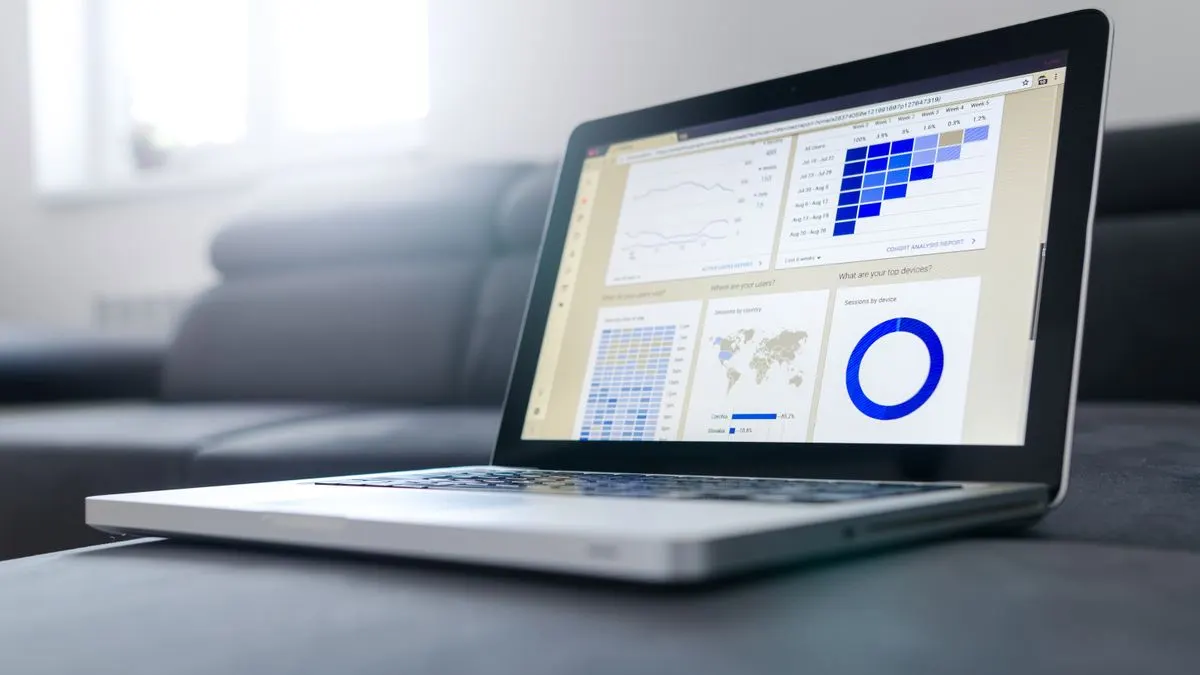
A custom dashboard is a screen that automatically pulls together your business's key figures and shows them clearly. Revenue, open quotes, scheduling, leads from the website: you see it all at once, without first opening five programs or updating an Excel sheet.
Many business owners steer on gut feeling, because the figures are scattered and gathering them takes too much time. A good dashboard solves that. In this article you'll learn which figures belong on it, how the data gets there, when off-the-shelf dashboard software is enough and when a custom build fits better.
What exactly does a custom dashboard do?
A dashboard does three things. It fetches data from your systems, such as accounting, CRM, online shop or scheduling. It turns that data into figures you understand, such as margin per job or number of enquiries per week. And it shows them in charts, tables and alerts you can read in a few seconds.
The difference from a report is that a dashboard is always up to date. You don't have to wait until someone puts together an overview at the end of the month. Depending on the sources, it refreshes every few minutes, every hour or every night.
An example. An installation company wants to know every Monday how many quotes are open, how many jobs are scheduled this week and which invoices are overdue. Right now someone looks that up in three systems. With a custom dashboard it's simply there, fresh every morning, and you immediately see where you need to adjust.
Which figures belong on a KPI dashboard?
KPI stands for key performance indicator: a figure that shows whether you're on track. The trap is showing too much. Nobody looks at a dashboard with thirty charts. Choose five to ten figures you really steer by.
- Sales: revenue this month versus last month, open quotes, average order value.
- Marketing: number of enquiries per source, cost per enquiry, visitors from Google.
- Operations: scheduled and completed jobs, team utilisation, lead time.
- Finance: outstanding invoices, overdue payments, margin per product or job.
- Customers: number of complaints or repeat purchases, new reviews.
A good test: would you act differently if this figure went up or down? If not, it probably doesn't belong on your dashboard.
Where does the data come from?
A dashboard is only as good as the data that goes into it. Most modern software has an API, a fixed entry point through which other programs can fetch data. That's how you connect your dashboard to your sources. You can read how such a connection works in getting an API integration built.
- Accounting software for revenue, invoices and payments.
- CRM for leads, quotes and customers.
- Online shop for orders and products.
- Google Analytics for visitors and conversions on your website.
- Your own scheduling or time tracking.
- Excel files, as an interim step, although that's less reliable.
When building a dashboard, it often turns out that data isn't right: the same customer appears twice in the CRM, or jobs have no fixed category. That's not a problem with the dashboard, but the dashboard does make it visible. Plan time to clean it up.
Off-the-shelf dashboard software or a custom dashboard?
There are good off-the-shelf tools, such as Power BI, Looker Studio or the reports in your accounting software. When do you choose which?
- Off-the-shelf tool: good if your sources are well-known packages with ready-made connectors, and if you or a colleague has time to set it up and maintain it yourselves.
- Dashboard in your existing software: many packages have their own overview. Fine if all your figures live in that one package.
- Custom dashboard: a good fit if your data comes from lots of different systems, if you need your own calculations, or if the dashboard needs to be part of your own web application or customer portal.
A custom dashboard has another advantage: you decide who sees what. An engineer sees their own schedule, a manager sees the margin, a customer only sees their own orders. That's often harder to arrange in separate tools. With off-the-shelf tools, also watch out for per-user licence costs; they add up as your team grows (indication only, check the current price).
How to approach getting a dashboard built
- Start with your questions, not the charts. Which questions do you want answered every Monday morning?
- Link each question to a figure and a source.
- Check whether those sources can be connected properly and whether the data is right.
- Make a first version with a few figures and really use it for two weeks.
- Remove what you don't look at and add what you're missing.
- Agree who is responsible for the accuracy of the data.
Want to fully automate the reports you currently make by hand? Also read automating reports. If you mainly work with spreadsheets now, replacing Excel with software might be the first step.
Common mistakes with a business dashboard
- Too many figures at once, so the most important ones no longer stand out.
- Figures without comparison. A revenue figure says little without last month or a target next to it.
- No owner. If nobody looks after the data, everyone loses trust in it after a while.
- Showing personal data that isn't needed. Show totals instead, with GDPR in mind.
- Build it and forget it. Your business changes, so your dashboard needs to grow with it.
Getting a custom dashboard built by Violexa
At Violexa we build dashboards as part of AI & automation: we connect your sources, calculate the figures and display them so you can act on them in a few seconds. Violexa is a small studio run by founder Hisham, based in Amsterdam, working for businesses across the Netherlands.
An automation project starts from €1,799 excl. VAT (€2,177 incl. VAT), one-off. For a bigger dashboard with many sources, you get a fixed price on paper upfront. If your dashboard needs to keep running smoothly later on, that's possible with a maintenance plan from €179 excl. VAT (€217 incl. VAT) per month.
Want to know which figures you're missing now and how to get them on one screen? Request a free quickscan. A 30-minute conversation, online or on site, followed by brief written advice and a price indication. No obligation.
Frequently asked questions
How much does a custom dashboard cost?
That depends on the number of sources, the calculations and who gets access. At Violexa, an automation project starts from €1,799 excl. VAT (€2,177 incl. VAT), one-off. Bigger dashboards get a fixed price upfront.
Is Power BI enough for a small business?
Often, yes, if your sources have standard connectors and someone has time to set it up and maintain it. If your data comes from lots of different systems or you want the dashboard inside your own software, a custom build is often more practical.
How often is a dashboard updated?
That depends on the sources and your needs. Some figures refresh every few minutes, others once a night. For most small businesses, daily or hourly is more than enough.
Which KPIs should a small business track?
Choose five to ten figures you really steer by. Think of revenue, open quotes, enquiries per source, utilisation and outstanding invoices. Always show them with a comparison, such as last month or a target.